


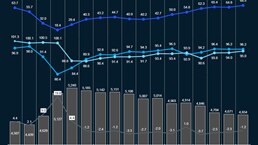
Brent crude oil prices decreased in February to an average of USD75.4/bbl m-o-m, a decline of USD3.8/bbl compared to the previous month average. Uncertainty over the impact of US tariffs and planned OPEC+ production increase led to a downswing in prices in February, offsetting even the demand increase:
- Global oil demand. Global liquids demand reached an all-time high in February, increasing by 2.4 MMb/d m-o-m to 105.2 MMb/d. This was driven mainly by Europe, China, and India, with a demand growth of 0.8 MMb/d, 0.5 MMb/d, and 0.4 MMb/d, respectively
- OPEC 9 production (excl. Iran, Venezuela, Libya). OPEC 9’s production declined slightly by ~0.1 MMb/d to 27.0 MMb/d in February, with no major changes in production between the constituent countries. A gradual unwinding of OPEC+’s 2.2 MMb/d in production cuts is set to start from April 2025
- Non-OPEC production (excl. US shale). Non-OPEC production increased by 0.8 MMb/d m-o-m to 62.4 MMb/d. The production growth was driven by the US and Brazil, accounting for around 0.4 MMb/d and 0.2 MMb/d, respectively
- US shale oil production. US shale production increased m-o-m by 0.1 MMb/d averaging at 8.9 MMb/d in February. The number of active rigs stood at 568 in February, up by eight units compared to January 2025
- Iran, Venezuela, Libya production. Combined production levels in Iran, Venezuela, and Libya slightly rose by ~0.1 MMb/d m-o-m, averaging at 5.6 MMb/d during February 2025. Production levels have been steadily increasing since September 2024, mainly driven by Libya
- Commercial inventories.1 Global commercial inventories declined by ~12 million barrels in February, driven by a decline in OECD inventories. Overall, inventories have remained relatively steady at ~4.4 billion barrels over the last five months
- Market sentiment. Multiple factors are expected to have contributed to the oil price decline in February, such as reports of OPEC+ proceeding with planned oil output increase in April and worries over US tariffs that could hurt global economic growth and oil demand. Additionally, the volatility is fueled by ongoing discussions of a ceasefire between Russia-Ukraine and its possible impact on oil markets
1 Non-OECD share of inventories is estimated, assuming that non-OECD inventories have 50% days of demand cover of OECD inventories
Download dashboard:
Oil supply & demand dashboard: March 2025
Subscribe to Energy Solutions
To receive our oil supply & demand dashboards, please subscribe to upstream oil and gas updates from Energy Solutions.